Call Observability Metrics
Understand the call observability metrics used to measure AI agent latency, errors, interruptions, and quality signals.
Call Observability
Overview
The Call Observability tab (Conversation Intelligence > Call Observability) provides a centralized, real-time view of AI agent health by surfacing latency, errors, interruptions, and quality signals. Metrics are directly linked to underlying transcripts to enable fast debugging and iteration.
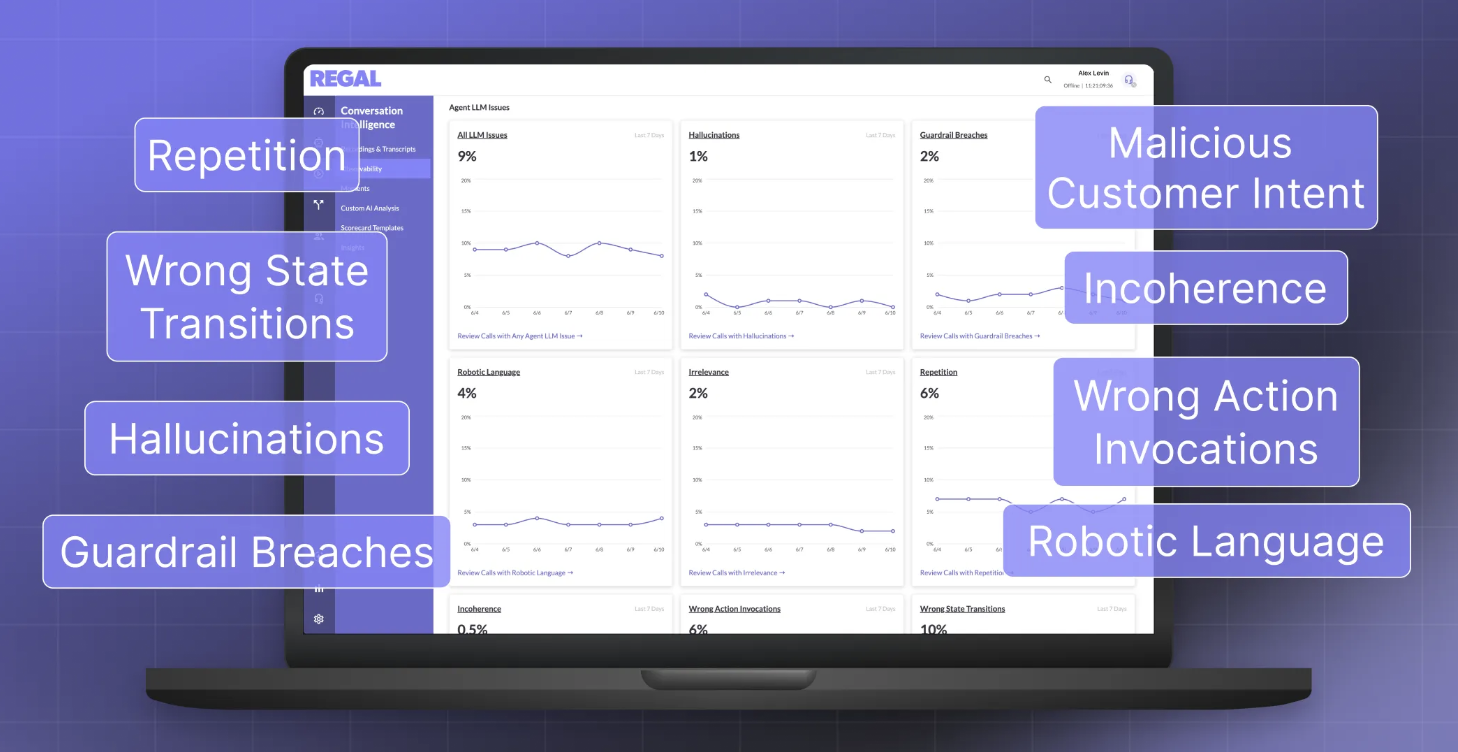
Noteworthy:
- Metrics are computed shortly after call completion.
- All time-series charts display P50 and P90 values.
- All metrics are filterable by date range and agent.
Data Cuts
Metrics can be viewed across three different “cuts” of calls, each serving a different purpose:
- All Calls
Includes every inbound and outbound call handled by the system.
Best for: overall volume and funnel health. - Interaction Calls
Calls with at least one user turn and one agent turn.
Best for: latency, interruptions, and turn-based performance metrics. - Connected Calls (Disposition-Based)
Calls marked as “Answered” based on system and configured dispositions.
Best for: business-level reporting aligned with customer definitions.
Event-Driven Metrics
Call Minutes
- Description: Total duration of calls handled by AI agents.
- Calculation: Sum of call durations across all calls within selected time range.
End-to-End (E2E) Latency
- Description: Time between customer input and agent response (the perceived delay between turns).
- Calculation: For each turn, measure time from end of user speech to start of agent response; aggregated as P50/P90 across calls.
These components do not always happen in a linear timeline, but together they represent what can drive overall E2E latency.
| Component | Definition | Levers to improve |
|---|---|---|
| First turn latency | Customer + Regal. Time from call connection to the agent's first spoken word. Includes answering machine detection (AMD), greeting generation via the LLM, and dialer overhead. | Use a static greeting to skip first-turn LLM generation. Tune AMD settings. Adjust dialer configuration. Reduce and restructure the system prompt. |
| Speech-to-text | DeepGram via Livekit. Time to transcribe the caller's speech into text. This is typically one of the smaller contributors to total E2E latency. | Limited direct control because this is provider-dependent. Regal evaluates STT providers for speed. |
| End of utterance | Customer-tunable. Time for the system to detect that the caller has finished speaking. This includes voice activity detection (VAD), DeepGram transcription delay, and Livekit end-of-turn detection. This delay happens before the LLM starts generating a response. | Tune the responsiveness setting in agent config. Shorter end-of-turn delay can reduce perceived latency, but it can clip callers who pause mid-sentence. This is often an overlooked source of higher E2E latency. |
| LLM latency | Largest component. Time to first token (TTFT): how long the LLM takes to generate the first token of its response. TTFT of 500 ms or less is generally sufficient for most voice AI use cases. This is usually the largest contributor to E2E latency and scales with prompt length. | Reduce and restructure the prompt. Pre-emptive generation can also help. Regal engineering is exploring self-hosted inference and caching options. |
| Text-to-speech | Customer-tunable. Time to first byte (TTFByte): how long the TTS provider takes to begin generating audio from the LLM's text output. This is generally a smaller contributor than LLM latency. | Switch the voice vendor on the agent. Test alternative voices within the same provider because latency can vary by voice model. Regal also evaluates TTS providers for speed and quality. |
| Network / other | Hard to control. Additional latency from network transit, audio decoding, microphone processing, and other system overhead. This is measured as the gap between total silence and the start or end of what is received from Livekit. | Minimal direct control. Most improvements come from infrastructure-level optimizations by Regal engineering. |
| Function invoke-to-response | Customer + Regal. Time from the start of a function or action invocation to function completion. This should be grouped by function type, such as transfer, schedule, or custom API call, to make comparisons useful. It may include intentional delays such as transfer bridge statements. | Improve response times for customer-owned API endpoints. Add bridge statements before slow actions to reduce perceived latency. For default actions such as schedule_callback and warm_transfer, Regal engineering owns fixes. |
| Multi-state transition | Under investigation. Time for the agent to transition between states in a multi-state flow. This is measured from LLM time-to-first-byte through the TTS provider. Non-latency metadata, such as the state transition itself, will be surfaced separately. | This is an active engineering workstream and is not yet customer-tunable. |
Action Latency
- Description: Time taken for an action/tool call to execute during a conversation. The time CAN include agent speech if Speak During is configured for the action.
- Calculation: Time from action invocation to action completion; aggregated per action and agent as P50/P90.
Action Failures
- Description: Rate of failed action/tool executions. Only true failures are reflected, i.e. if agent retried successfully it will not be reflected in the failed action %.
- Calculation: (# failed action calls) / (total action calls) over time.
Contact Interruption Rate
- Description: Frequency at which the user interrupts the agent mid-response.
- Calculation: (# turns where contact interrupts agent) / (total turns), aggregated as P50/P90 per call.
LLM Metrics
Robotic Language Rate
- Description: The AI agent broke conversational immersion by narrating technical mechanics (e.g., "calling a function," "querying the database") or exposing raw error codes instead of speaking naturally.
- Calculation: (# calls with
robotic_languagedetected) / (total calls).
Repetition Rate
- Description: The AI agent repeated the same information or phrasing in consecutive turns without being asked to, which can feel redundant or confusing.
- Calculation: (# calls with
repetitiondetected) / (total calls).
Guardrail Breaches
- Description: The AI agent broke one of its configured hard rules (e.g., exceeded a sentence limit, skipped a required confirmation, or failed to say a mandatory disclosure).
- Calculation: (# calls with
guardrail_breachdetected) / (total calls).
Policy Hallucinations
- Description: The AI agent stated a policy, price, capability, or internal detail (including system prompt/tool names) that isn't actually true or supported by its configuration.
- Calculation: (# calls with policy-scope
hallucinationdetected) / (total calls).
Tool Hallucinations
- Description: The AI agent claimed a tool action succeeded (e.g., "your payment was processed," "I transferred you") when it actually failed or never happened.
- Calculation: (# calls with tool-state-scope
hallucinationdetected) / (total calls).
Irrelevant Responses
- Description: The AI agent's reply didn't actually address what the customer asked or said, without a good reason for the redirect.
- Calculation: (# calls with
irrelevant_responsedetected) / (total calls).
Incoherence Rate
- Description: The AI agent contradicted itself (within one message or across turns) or produced a reply that doesn't logically follow.
- Calculation: (# calls with
incoherencedetected) / (total calls).
Malicious Customer Handling
- Description: The customer tried to manipulate or "jailbreak" the AI agent (e.g., asking for its instructions or pretending to have override access), and the AI agent partially or fully went along with it instead of properly refusing.
- Calculation: (# calls with
malicious_customer_handlingdetected) / (total calls).
Tool Failure Handling
- Description: A tool call failed, but the AI agent responded poorly (e.g., claimed it succeeded anyway, exposed a raw error, or got confused instead of recovering gracefully).
- Calculation: (# calls with
tool_failure_handlingdetected) / (total calls).
Tool Parameter Errors
- Description: The AI agent called a tool with the wrong information (e.g., a name, date, or option that contradicts what the customer actually said or an invalid enum value).
- Calculation: (# calls with
tool_parameter_errordetected) / (total calls).
Wrong Function Calls
- Description: The AI agent used the wrong tool, an unregistered tool, called it out of order/too early, forgot to call a required one, or announced a tool call that was supposed to happen silently.
- Calculation: (# calls with
wrong_function_calldetected) / (total calls).
Wrong State Transitions
- Description: The conversation moved to (or failed to move to) the wrong step/state in its configured flow given what had actually happened so far.
- Calculation: (# calls with
wrong_state_transitiondetected) / (total calls).
Contact Issues
Malicious Intent
- Description: Percentage of calls where the contact attempted to jailbreak the agent, extract sensitive data, or otherwise subvert normal call handling.
- Calculation: (# calls with malicious intent detected) / (total calls).
Language Barrier
- Description: Percentage of calls where the contact did not speak the agent's configured language, impeding effective communication.
- Calculation: (# calls with language barrier detected) / (total calls).
Coming Soon
- Asking Regal Copilot (in app) and Regal MCP (external) about these metrics, speeding up agent iteration
Updated 3 days ago
Did this page help you?